From Care2:
World Ocean Health – A Failing Grade
and from the source article in Nature (entire article avail. for purchase at link with higher-res images included of course):
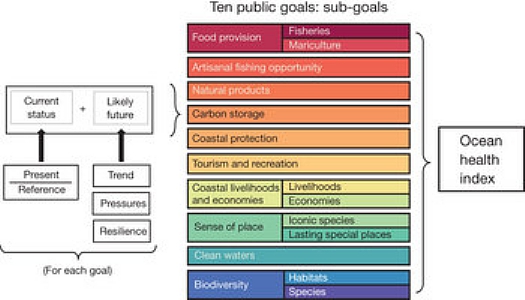
Each dimension (status, trend, pressures and resilience) is derived from a wide range of data. Dimensions combine to indicate the current status and likely future condition for each of ten goals….
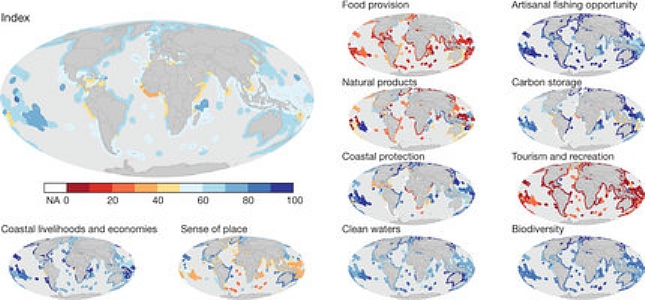
All waters within 171 exclusive economic zones (EEZs), that is, up to 200 nautical miles, were assessed and are represented on the map.
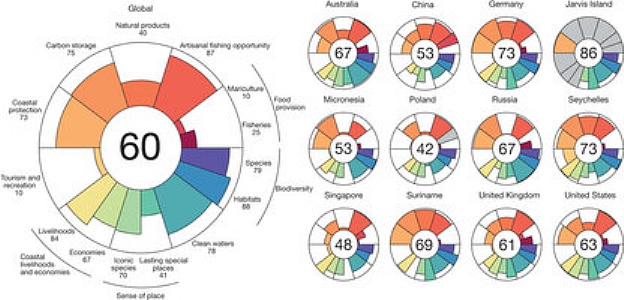
Index scores (inside circle) and individual goal scores (coloured petals) for global area-weighted average of all countries and for several representative countries.
The outer ring is the maximum possible score for each goal, and a goal’s score and weight (relative contribution) are represented by the petal’s length and width, respectively…..
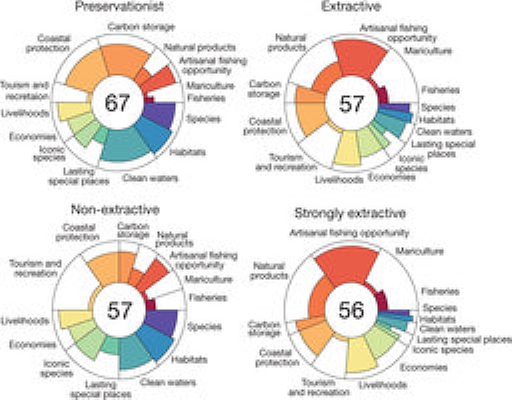
Value sets are illustrative rather than prescriptive; labels for the value sets are approximations and should not be interpreted literally.
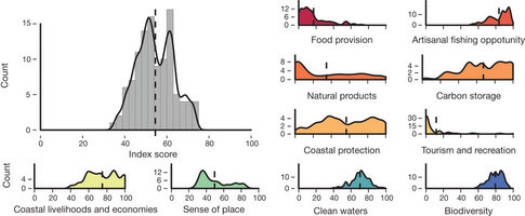
Histogram plots are smoothed across five point bins; dashed vertical line is the arithmetic mean and so differs from the area-weighted mean in other figures. Note different scales on y axes.
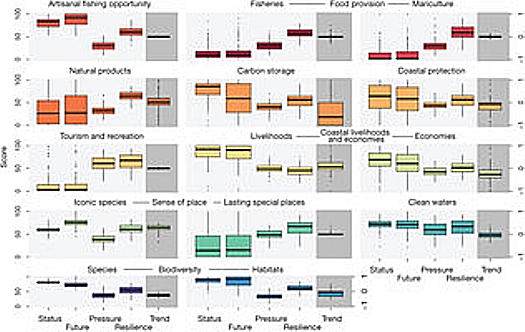
Histograms are shown separately for each sub-goal. Note the different scale for trend (right y axis).
E. Fudd